Troubleshoot a Flow run
查看 MarkdownThis page helps you find why a Flow does not advance or fails. Start with Worker availability. Then follow the read-only debugging workflow.
Worker API availability
When a Worker cannot receive or complete a Step call, a Flow cannot advance. You may see a Step remain active, retries increase, or a terminal failure after the retry policy is exhausted.
Check these items in order:
- Collect the Flow ID, Run ID, Flow type, Worker version, and Dex Server address. Put them in the incident record before changing anything.
- Check the Worker logs for handler exceptions, registration failures, and startup configuration. Include the Flow ID or Run ID in log searches.
- Check the network route between Dex Server and the Worker: service discovery, address, TLS, authentication, and any load-balancer health checks. For a pull Worker, check that its outbound streams to the server are connected.
- Confirm that the deployed Worker registered the Flow, Step, and RPC names used by the open Flow. A deployment can be healthy while an old Step type is missing from that Worker version.
- Inspect the affected Step in Dex Web. The retry attempt, Worker error, gRPC status, and stack trace distinguish an unavailable Worker from an application failure.
After fixing availability, let an active retry continue when its retry budget is still valid. For a terminal Flow, verify the fix with a new run first, then use Time Travel from a safe Step boundary when that is the intended recovery. Do not restart or time travel a Flow merely to test connectivity.
Flow failure and timeout
A Flow can fail because a Worker handler returns a failure, Worker retries are exhausted, or the Flow reaches its configured timeout.
Flow timeouts are durable Dex timers configured when a Flow starts; zero disables them. Choose FAIL, CANCEL, or a Flow timeout handler. Inspect the start event for the configured duration and resolved policy. The deadline is absolute.
Every positive timeout has one internal sys:timeout_handler timer. It is visible in active-Step diagnostics and SkipTimer can fire it early by timer index. Fix the underlying cause before recovering a failed timeout.
Read-only debugging workflow
Start with Dex Web. It shows the durable, application-level record before you need to inspect raw JSON.
1. Select the relevant event
Open the Flow by Flow ID and Run ID, choose Timeline, then select the Step event that is waiting, completed, or failed. The right-side Selected event panel identifies the event number and its type.
The event number is the event ID. It stays the same on every page and after pruning. Timeline shows at most 1,000 events per page and opens on the newest page. Use Older events and Newer events to move between pages. Use Newest to return to the page that Live keeps extending.
The Selected event panel lists Related events: the event's WaitFor, its source execution, and the executions it started. Each entry is loaded, on another page, pruned, or not on this page. Not on this page means Dex Web knows the related event exists but cannot locate it, so it offers no jump. Select an entry on another page, or its stub at the top or bottom of Timeline, to load that page and highlight the event. Back returns to the previous page. Dex Server keeps only a recent history window. A pruned related event appears muted with a pruned badge. The oldest retained page states which event numbers were removed.
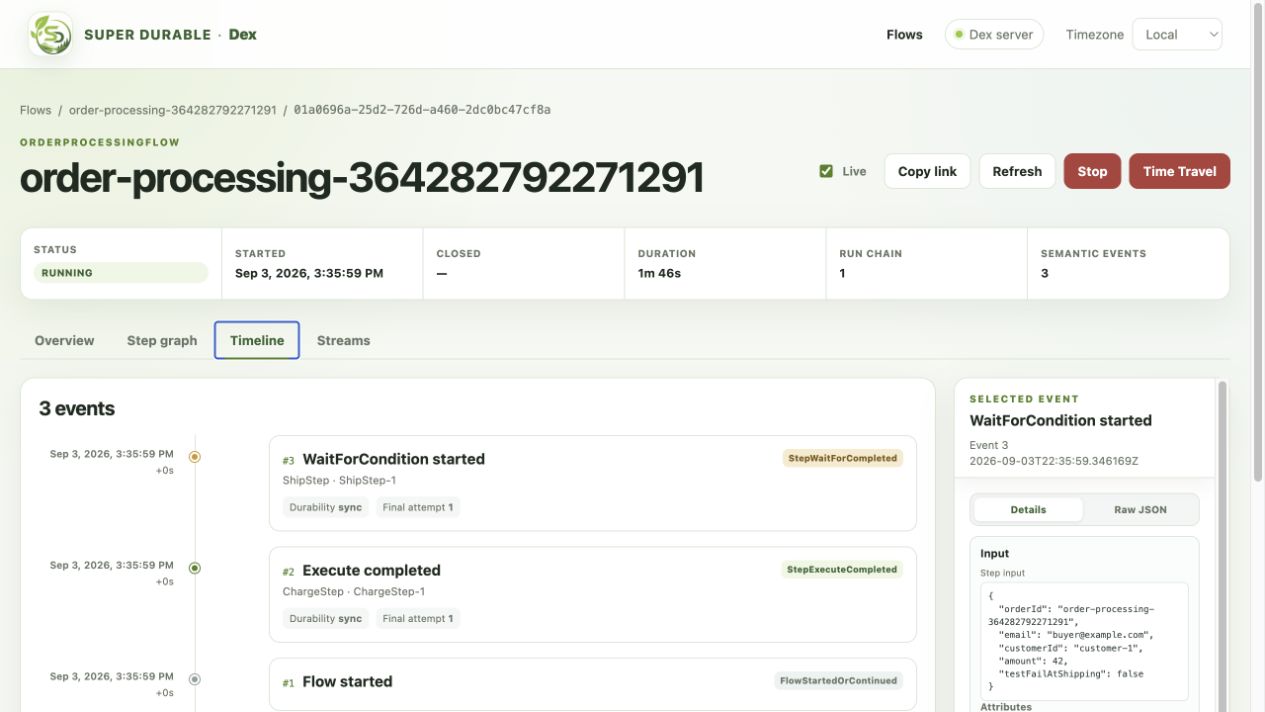
2. Read inputs, Attributes, conditions, and outputs
In Details, read Input first. The panel shows the Step input, durable Attributes, and condition results available at that event. For a completed Step, continue to Output to inspect the Step decision, the next Step input, and resulting Attribute changes.
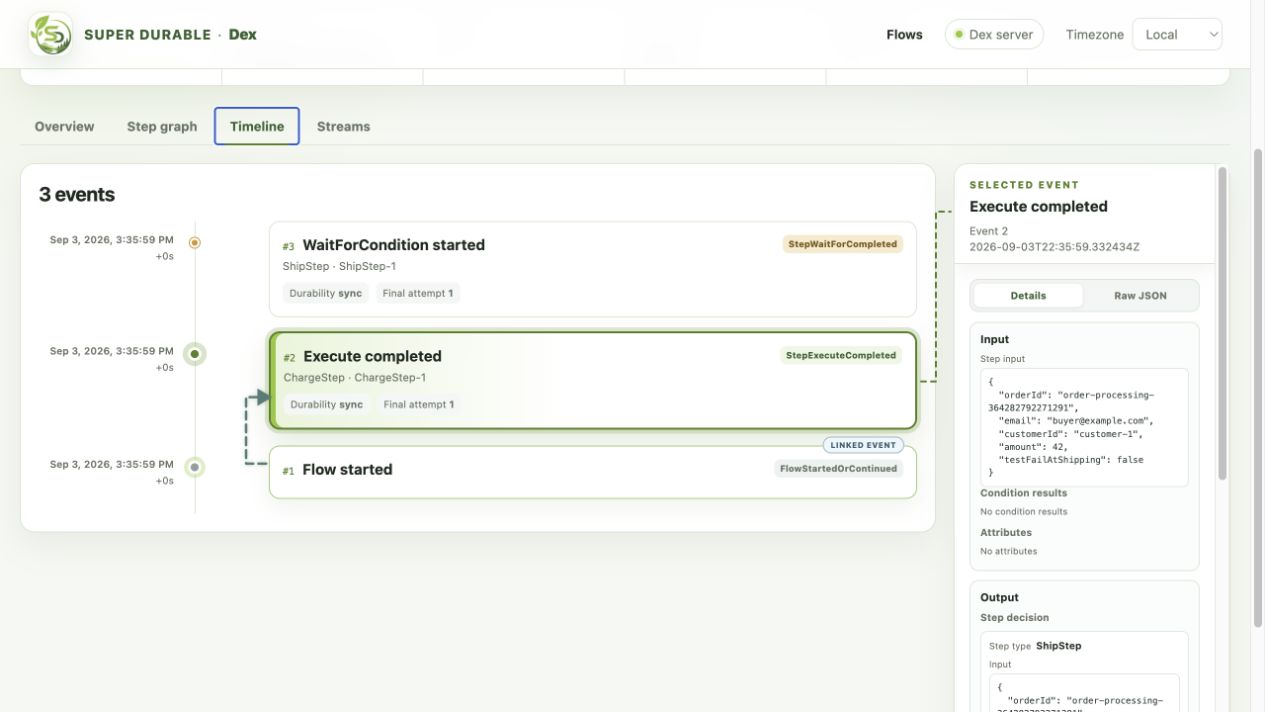
3. Expand a failed Step's stack trace
For a retrying or failed Step, select the failed event from Timeline or the failed node from Step graph. Under Failure, compare the attempt, Worker error type, error detail, and gRPC status. Expand Stack trace before asking the owning team to investigate.
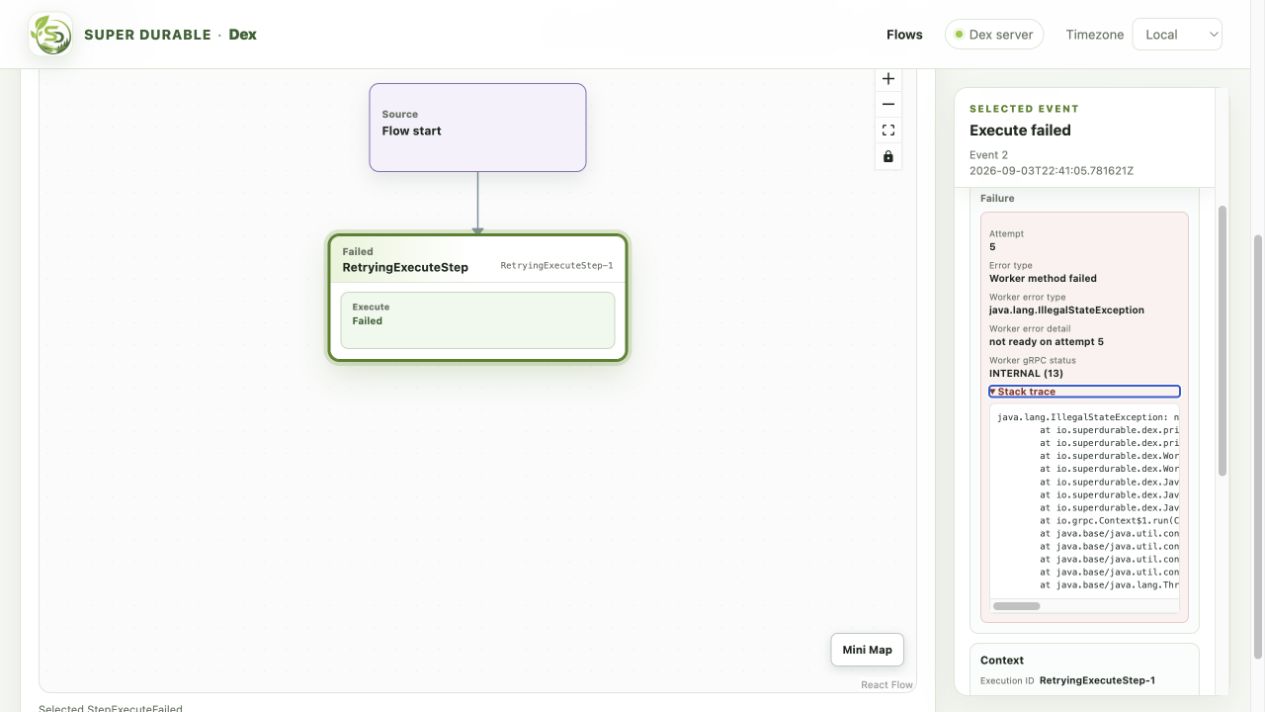
These screenshots use the repository's synthetic Java examples. They contain no credentials or production customer records.
4. Save auditable JSON with dexcli
Use the same Flow ID and Run ID in the CLI. These commands are read-only and print JSON, so attach their output to an incident or retain it in secure diagnostic storage.
dexcli flow inspect FLOW_ID --run-id RUN_ID

dexcli flow history FLOW_ID --run-id RUN_ID --all

dexcli flow inspect FLOW_ID --run-id RUN_ID --all-history --no-hydrate

dexcli flow history FLOW_ID --run-id RUN_ID --all --no-hydrate
dexcli flow inspect returns the current Flow summary and state when it is available. dexcli flow history returns semantic events. Use --all to retrieve every history page. Dex Server keeps only a recent history window, so --all returns the retained events. Use --no-hydrate when payloads may be large or sensitive: the output retains blob references instead of fetching their contents.
5. Ask the Dex SDK skill for an investigation
The Dex SDK skill can guide a repository-aware investigation. Give it the identifiers and require a read-only first pass. Use the invocation syntax for the selected Plugin or standalone installation, followed by this request:
Diagnose Dex Flow FLOW_ID, Run ID RUN_ID. The Worker version is
WORKER_VERSION and Dex Server is SERVER_ADDRESS. First perform read-only checks:
inspect Dex Web, application logs, dexcli flow inspect, and dexcli flow history
with --all. Do not stop, time travel, restart, or otherwise modify a Flow unless
I explicitly authorize that action. Report the suspected failing Step, evidence,
and the safest recovery option.